
Cost per booked move is simple to divide and easy to misstate. The calculation becomes misleading when spending and bookings come from different cohorts, duplicate jobs inflate the denominator or costs are included inconsistently. Establish the counting rules first, then use the result to compare acquisition efficiency.
 View full-size graphic ↗
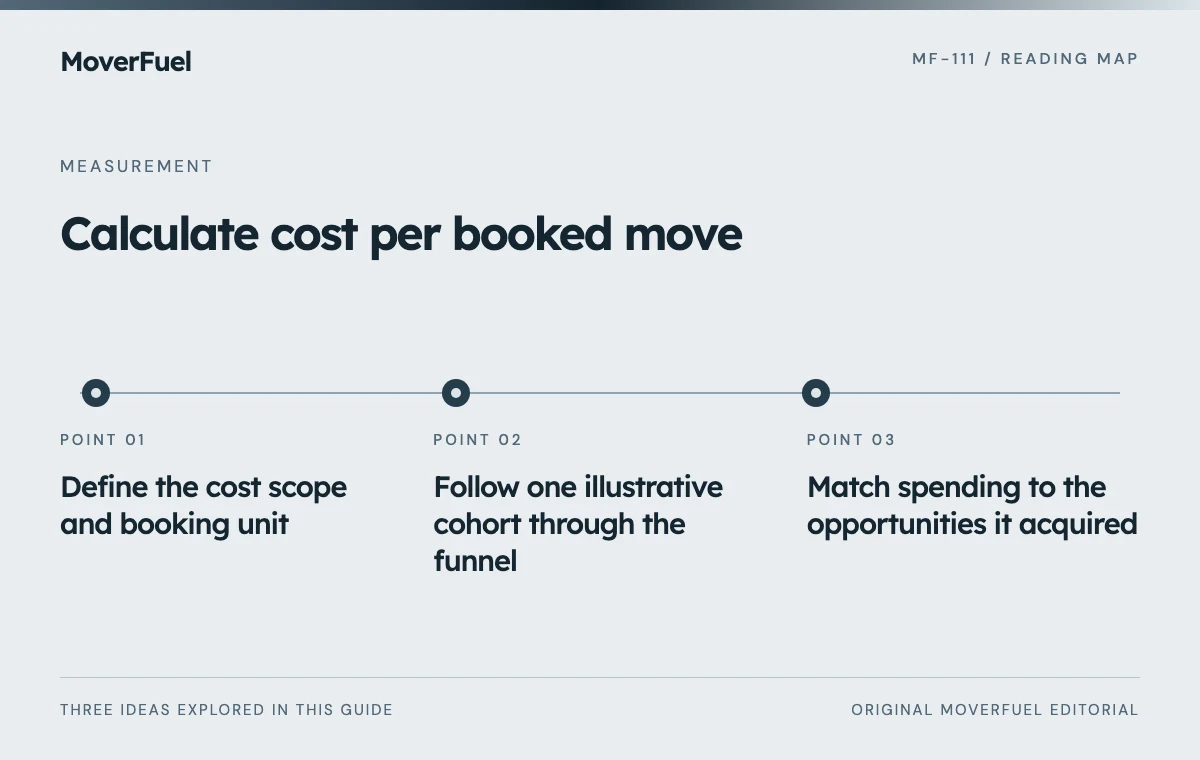
Define the cost scope and booking unit
The basic formula is acquisition cost assigned to a cohort divided by unique booked moves from that cohort. State whether acquisition cost includes only media, media plus management, or a fuller set of campaign and intake costs. None of those labels should be silently interchanged.
Scroll the table horizontally to compare all columns.
| Field | Decision required |
|---|---|
| Cohort | Which inquiry acquisition dates and sources are included? |
| Cost scope | Media only or defined broader acquisition costs? |
| Booking | What evidence establishes a committed move? |
| Unique unit | One opportunity, project or separately sold job? |
| Observation date | How long have these inquiries had to mature? |
| Corrections | How are duplicates, cancellations and rebookings handled? |
Use an identifier that matches the business unit. A project with several crew days should not automatically become several acquired customers. If separate jobs are intentionally counted, name the metric accordingly and apply the rule consistently.
Follow one illustrative cohort through the funnel
Scroll the table horizontally to compare all columns.
| Item | Value |
|---|---|
| Media spend | $6,000 |
| Assigned management and creative | $1,500 |
| Total defined acquisition cost | $7,500 |
| Unique inquiries | 150 |
| Qualified opportunities | 90 |
| Unique bookings | 30 |
| Completed moves | 25 |
Using the defined $7,500 cost, raw cost per inquiry is $50, cost per qualified opportunity is approximately $83.33, cost per booked move is $250 and cost per completed move is $300. The figures are illustrative, not industry benchmarks or MoverFuel results.
If you report media-only cost per booked move, the result is $6,000 ÷ 30 = $200. That is a valid narrower calculation when labeled clearly. It is not the same as the $250 figure that includes the assigned management and creative cost.
Keep rounding consistent. Use the underlying counts and costs for calculations, then round the displayed amount. Do not calculate a total by averaging rounded source-level costs without weighting them by the appropriate booking counts.
Match spending to the opportunities it acquired
Create the cohort from inquiry acquisition dates, then follow its bookings over time. A report of bookings made this month may include inquiries from earlier months. Dividing current spend by that total answers a different and often unstable question.
Supermove's official reporting guide allows filtering by different dates and warns that one project can appear on multiple milestone rows. Check the underlying unit and date choice when exporting data; a row count is not automatically a count of unique booked moves. [1]
Label preliminary and mature results
A recently acquired cohort may still contain active estimates. Publish its observation date and unresolved count. Compare sources at similar maturity or explain why their cycles differ. Do not close every open record as lost merely to make a monthly ratio look final.
For recurring management or content costs, choose a defensible allocation method and document it. Shared investments may not belong to a single campaign. Report them separately when a precise allocation would create more fiction than insight.
Keep booking and completion economics side by side
A booking can cancel, reschedule or change scope. Preserve the original booking event and report subsequent outcomes according to a clear policy. If a canceled record is replaced by a new one, reconcile them so the same opportunity does not create two acquisition wins.
In the example, 30 bookings become 25 completed moves. The acquisition cost has not changed, but the cost per completed move is higher. That difference helps identify whether cancellation or fulfillment issues are weakening the economic result.
Use the marketing outcome ladder to define the stages before interpreting their costs.
Do not assume every cancellation is caused by marketing quality. Customer plans, availability and operational issues can all contribute. Record reasons where known and leave unknown reasons visible.
Use acquisition cost with job contribution
A lower cost per booked move is not automatically better if the source produces lower-value or more expensive-to-serve work. Compare service mix, completed revenue and relevant fulfillment costs before reallocating budget.
Scroll the table horizontally to compare all columns.
| Check | Reason |
|---|---|
| Same cost scope | Prevents media-only versus fully loaded comparisons |
| Same maturity | Avoids penalizing slower sales cycles |
| Unique opportunities | Prevents duplicate-contact inflation |
| Comparable service mix | Explains different job economics |
| Sufficient observations | Reduces overreaction to a few outcomes |
Use the metric to locate a question: are leads expensive, qualification weak, estimates delayed or completions falling? The ratio summarizes the result; the stage records explain what can be improved.
Common questions
Should agency fees be included?
Include them in a clearly defined broader acquisition-cost view, and keep a separately labeled media-only view if useful. Apply the same scope when comparing sources.
Can I divide this month's spend by this month's bookings?
You can report that calendar ratio, but it may mix different acquisition cohorts. For source economics, match costs to the inquiries that produced the bookings.
Your next step
State the cost scope, count unique bookings and match the cohort. Then follow completions and contribution so a low acquisition ratio does not hide weak job economics.
Sources & editorial notes
Platform claims cite the documents below. Operating frameworks and labeled examples are MoverFuel editorial analysis, not client results or industry benchmarks.
- Supermove: Marketing Milestones SummaryDate filters and project-milestone row duplication in Supermove reporting. All numerical examples and cost formulas are original illustrative arithmetic. Reviewed .