
A campaign that generates three dollars of revenue for each dollar of advertising has not necessarily generated a profit. Moving work requires labor, vehicles, materials and coordination, and some customers may have booked without the campaign. A useful ROI discussion makes costs, attribution and uncertainty explicit instead of turning a revenue multiple into a profitability claim.
 View full-size graphic ↗
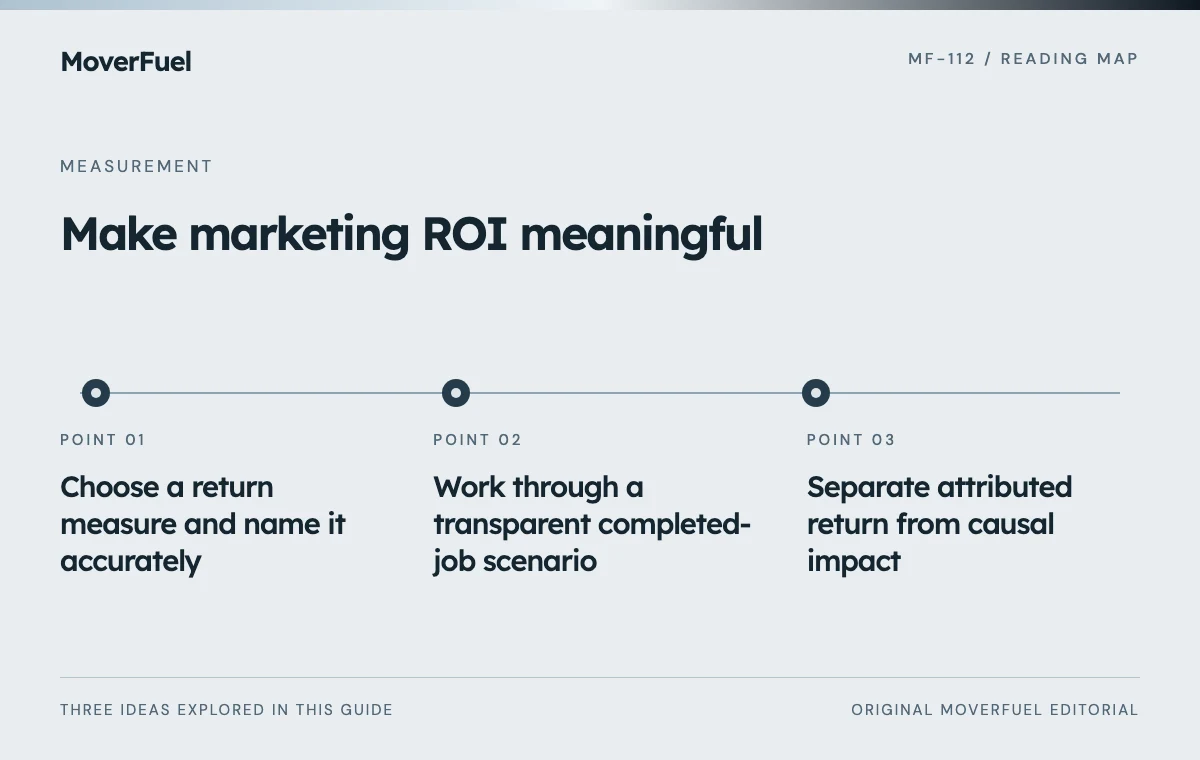
Choose a return measure and name it accurately
Return on ad spend compares attributed revenue with media spend. A contribution-based marketing return compares the contribution associated with the work against defined marketing costs. An incremental return asks what changed because of the marketing. These measures answer different questions.
Scroll the table horizontally to compare all columns.
| Measure | Simplified calculation | What it does not establish |
|---|---|---|
| Revenue ROAS | Attributed revenue ÷ media spend | Profit after fulfillment and overhead |
| Contribution after marketing | Revenue − variable fulfillment costs − defined marketing cost | Net company profit |
| Contribution-based return ratio | Contribution after marketing ÷ defined marketing cost | Causal incremental return |
| Incremental return | Incremental contribution net of incremental marketing cost, divided by that cost | A result available from attribution alone |
Contribution margin deducts variable costs from revenue and remains available for fixed costs and profit. Confirm cost classification with the business's accounting owner rather than assuming every expense behaves the same way. [1]
Work through a transparent completed-job scenario
Scroll the table horizontally to compare all columns.
| Input | Amount |
|---|---|
| Completed-job revenue | $40,000 |
| Variable fulfillment costs | $26,000 |
| Contribution before marketing | $14,000 |
| Media spend | $7,000 |
| Management, creative and other assigned marketing | $3,000 |
| Total defined marketing cost | $10,000 |
Revenue ROAS on media is $40,000 ÷ $7,000, or about 5.71 times. Contribution after the defined marketing cost is $14,000 − $10,000 = $4,000. Dividing that amount by $10,000 gives a 40% contribution-based return ratio before remaining fixed costs and taxes.
The 5.71 revenue multiple and 40% ratio are both mathematically correct under the assumptions, but neither should be labeled net company profit. The example also assumes the revenue and fulfillment costs belong to the same completed-job cohort and that marketing costs are allocated consistently.
Separate attributed return from causal impact
Attribution assigns credit among observed interactions. Google Analytics describes attribution in those terms and offers different credit-allocation models. A source receiving credit is not by itself proof that the customer would not have booked without that source. [2]
Ask what would have happened otherwise
Existing brand demand, repeat customers and other marketing may contribute to the same jobs. A causal estimate needs an appropriate comparison design, such as a carefully planned experiment, with its assumptions and uncertainty stated. Do not relabel an attributed dashboard total as incremental revenue.
When no causal test exists, present the analysis as attributed or associated cohort economics. That is still useful for management if the limits are clear. It is more credible than pretending every tracked dollar was created solely by the last click.
Test the variables that can change the decision
Scroll the table horizontally to compare all columns.
| Variable fulfillment cost | Contribution after marketing | Return ratio before remaining fixed costs |
|---|---|---|
| $24,000 | $6,000 | 60% |
| $26,000 | $4,000 | 40% |
| $30,000 | $0 | 0% |
A campaign can appear strong on revenue while becoming unattractive as fulfillment costs rise. Run scenarios for cancellations, lower average job value, additional sales effort and a different service mix. Use actual ranges where available rather than selecting assumptions that support a desired conclusion.
Treat zero marketing spend carefully: a return ratio with a zero denominator is undefined. Organic and referral acquisition may still involve content, relationship or staff costs, so ‘no ad spend’ should not automatically become ‘free marketing.’
Pair the return analysis with cost per booked and completed move to see which funnel stage explains a changing result.
Report timing and cash requirements alongside return
Advertising and setup may be paid before moves are completed and invoices collected. A favorable cohort return does not eliminate the need to finance that gap. Show the observation date, open opportunities, future bookings and outstanding collections separately.
Keep a reconciliation trail from the report to source costs and job records. Document refunds, credits and canceled work. If the data cannot support a reliable revenue or cost allocation, use a range and name the missing input rather than displaying a precise ratio.
Use the result to make a bounded decision: hold, repair, test an increase or reduce exposure. A single positive period is not a guarantee that a larger budget will preserve the same economics. Capacity and marginal demand can change as spending grows.
Common questions
Is ROAS the same as ROI?
No. ROAS is a revenue-to-ad-spend ratio. A useful ROI analysis needs a defined cost and benefit scope, and a causal claim needs evidence beyond attribution.
Can a campaign with high revenue ROAS lose money?
Yes. Fulfillment, marketing, fixed costs and other obligations may exceed the revenue contribution. Review the complete relevant economics.
Your next step
Name the measure, reconcile the cohort and expose the assumptions. Contribution-based analysis is useful when its cost scope and attribution limits remain visible.
Sources & editorial notes
Platform claims cite the documents below. Operating frameworks and labeled examples are MoverFuel editorial analysis, not client results or industry benchmarks.
- OpenStax: contribution margin and cost behaviorContribution margin and cost behavior; worked scenarios are original arithmetic. Reviewed .
- Google Analytics: get started with attributionAttribution is credit assignment across observed touchpoints, distinct from a demonstrated incremental effect. Reviewed .