
A demand forecast should help a moving company prepare for plausible outcomes, not make uncertain lead volume look guaranteed. Separate the demand customers may generate, the amount marketing can afford to pursue and the work the operation can deliver. Use ranges, preserve the assumptions and compare the forecast with actual observations as the period unfolds.
 View full-size graphic ↗
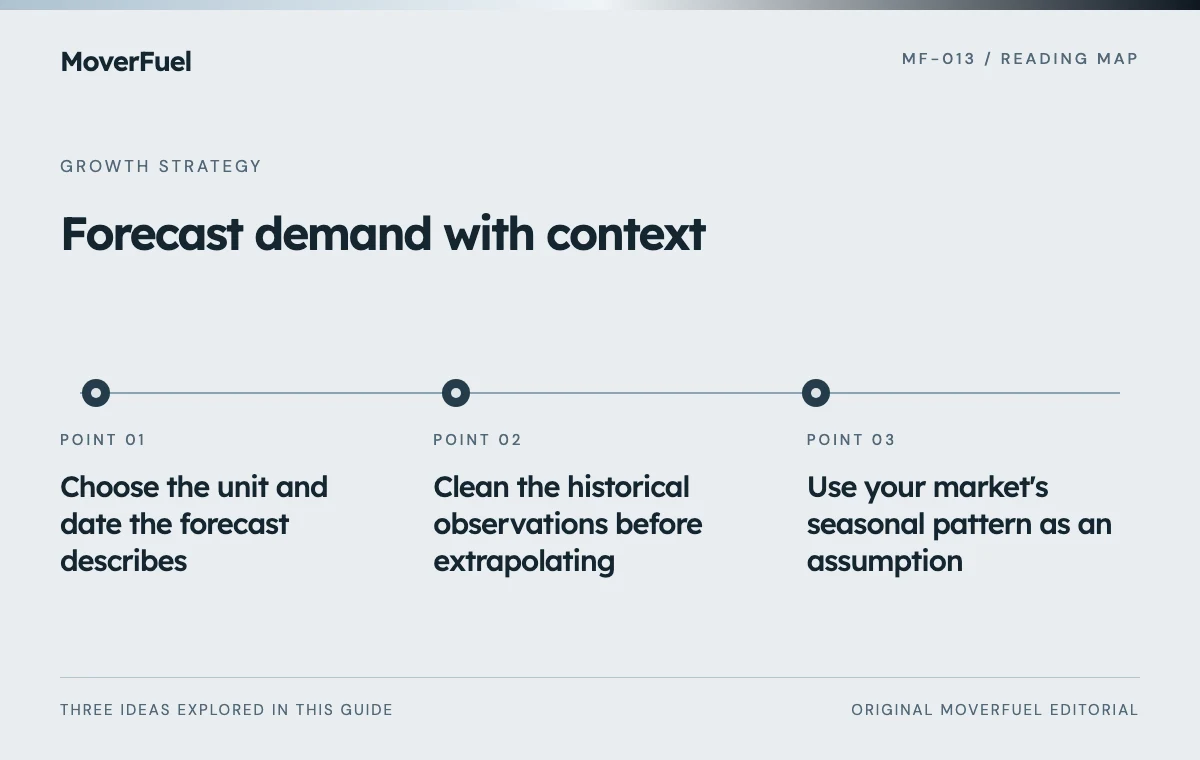
Choose the unit and date the forecast describes
Decide whether the forecast concerns unique inquiries, qualified opportunities, booked jobs or completed work. Then choose the relevant date: inquiry creation, booking acceptance or move execution. A forecast of next month's inquiries does not directly tell dispatch how many jobs will occur next month.
Use separate service or market views where their timing differs materially. A commercial project and an imminent local household move can create different gaps between first contact and service. The forecast should preserve that distinction instead of applying one blended conversion rate everywhere.
Scroll the table horizontally to compare all columns.
| Forecast | Planning use | Required distinction |
|---|---|---|
| Inquiry demand | Intake coverage and acquisition review | When customers first contact the business |
| Bookings from inquiries | Sales pipeline and expected work | How cohorts progress over time |
| Work scheduled for service | Dispatch, crews and equipment | When accepted jobs are actually performed |
Clean the historical observations before extrapolating
Assemble the relevant historical counts with their definitions, spending, service mix and tracking coverage. Identify duplicate contacts, missing source periods and changes in qualification rules. A sudden rise after a tracking change may describe better counting rather than more demand.
Annotate changes that altered the business
Mark branch openings, service expansions, staffing constraints, price changes and unusual campaign interruptions. An earlier period may still be informative, but it should not be treated as directly comparable when the operation or acquisition program was different.
- Use a consistent unique-inquiry definition.
- Record which channels and markets were active.
- Preserve spending and material offer changes.
- Flag periods with incomplete or unreliable tracking.
- Keep the original observations separate from later adjustments.
The SBA's planning guidance emphasizes keeping costs and effectiveness under review. A forecasting worksheet extends that discipline by making the historical inputs and their limitations visible before a future number is proposed. [1]
Use your market's seasonal pattern as an assumption
Inspect how inquiries and scheduled work vary across your own comparable periods. Different markets, services and customer groups can behave differently. A national statement about moving season does not establish the size or timing of the effect in your company's records.
Separate demand changes from spending changes. If advertising doubled in a busy period, the increase in paid inquiries cannot be attributed entirely to seasonality. Likewise, a quiet period with unanswered calls may understate the demand that was available.
Build low, base and high cases with explicit drivers
Choose a small set of drivers that change the decision: inquiry volume, qualification, booking progression and timing. Use observed ranges where the data supports them and label judgment-based assumptions. Avoid adding many decimal places to uncertain inputs.
Scroll the table horizontally to compare all columns.
| Input or outcome | Low case | Base case | High case |
|---|---|---|---|
| Unique inquiries | 80 | 100 | 120 |
| Qualification rate | 50% | 55% | 60% |
| Qualified opportunities | 40 | 55 | 72 |
| Booking rate among qualified opportunities | 30% | 35% | 40% |
| Expected bookings | 12 | 19.25 | 28.8 |
These are illustrative inputs, not industry benchmarks or predictions. Fractional bookings represent expected values across uncertain outcomes. Actual jobs are whole commitments, and they may fall into different service periods. The next step is to apply timing and completion assumptions before using the range for dispatch.
Check whether the drivers can plausibly move together. A higher-volume source might produce a lower qualification rate rather than the best value on every dimension. Add a mixed case when that tradeoff is important; a useful forecast should challenge optimism, not merely label it ‘high.’
Compare expected demand with fulfillment capacity
Translate expected work into the operating unit the company uses: crew-hours, crew-days, route slots or another appropriate measure. Compare it with committed work and saleable capacity. The same number of bookings can create different workloads depending on move size and service.
When the high case exceeds capacity, define the response before it occurs. Options may involve adjusting the offer, changing allocation, improving scheduling or evaluating additional resources. Do not assume that more advertising or more leads can resolve a fulfillment constraint.
The crew and truck capacity guide shows how to turn available operating time into a planning range.
Also compare the low case with the company's cash and staffing commitments. A demand forecast is useful because it helps prepare for both insufficient work and excessive demand. It should not be used only to justify an expansion that was already preferred.
Reforecast from new evidence and record the error
Review leading observations as the period progresses: inquiry pace, fit, response coverage and estimate activity. Keep the original forecast so the team can learn from the difference. Replacing it silently with the latest number destroys the evidence needed to improve the method.
Scroll the table horizontally to compare all columns.
| Observation | Question | Possible update |
|---|---|---|
| Inquiries below range | Did demand, spend, access or tracking change? | Revise the relevant driver after checking the cause |
| Qualification below assumption | Is the service mix different or the definition changed? | Separate the affected segment |
| Bookings lag the model | Is the cohort immature or the estimate process stalled? | Update timing or resolve the handoff |
| Capacity filled early | Which work is still saleable? | Revise the offer and acquisition plan |
At period end, compare the assumptions with observed outcomes and write one improvement for the next cycle. The forecast becomes more valuable when it reveals which driver the business understands poorly. Accuracy should improve through clearer data and better decisions, not through increasingly elaborate presentation.
Common questions
Can advertising budget predict lead volume?
It can support a scenario using an assumed cost per inquiry, but that cost is uncertain and can change. Keep the budget model separate from a guaranteed demand claim.
What if we have only a short history?
Use wider ranges, label assumptions and prioritize consistent data collection. Do not manufacture a seasonal pattern from too little comparable evidence.
Should forecasts be changed when results differ?
Update the working forecast when new evidence warrants it, but preserve the original version and the reason for the change. That history helps improve future assumptions.
Your next step
Define the unit, clean the history and build a range that exposes the important assumptions. Compare demand with capacity and update the model transparently. A useful forecast prepares the business for decisions instead of presenting uncertainty as certainty.
Sources & editorial notes
Platform claims cite the documents below. Operating frameworks and labeled examples are MoverFuel editorial analysis, not client results or industry benchmarks.
- SBA: marketing and salesMarketing-plan measurement and review. The scenario model, assumptions and arithmetic are original illustrative analysis, not externally sourced forecasts. Reviewed .