
A scorecard earns its place when it helps the team make a decision. If every available metric receives equal space, the report can become a weekly reading assignment with no operating consequence. Start with the decisions your moving company needs to make, then choose a small set of measures that show where the acquisition process is changing and who should investigate.
 View full-size graphic ↗
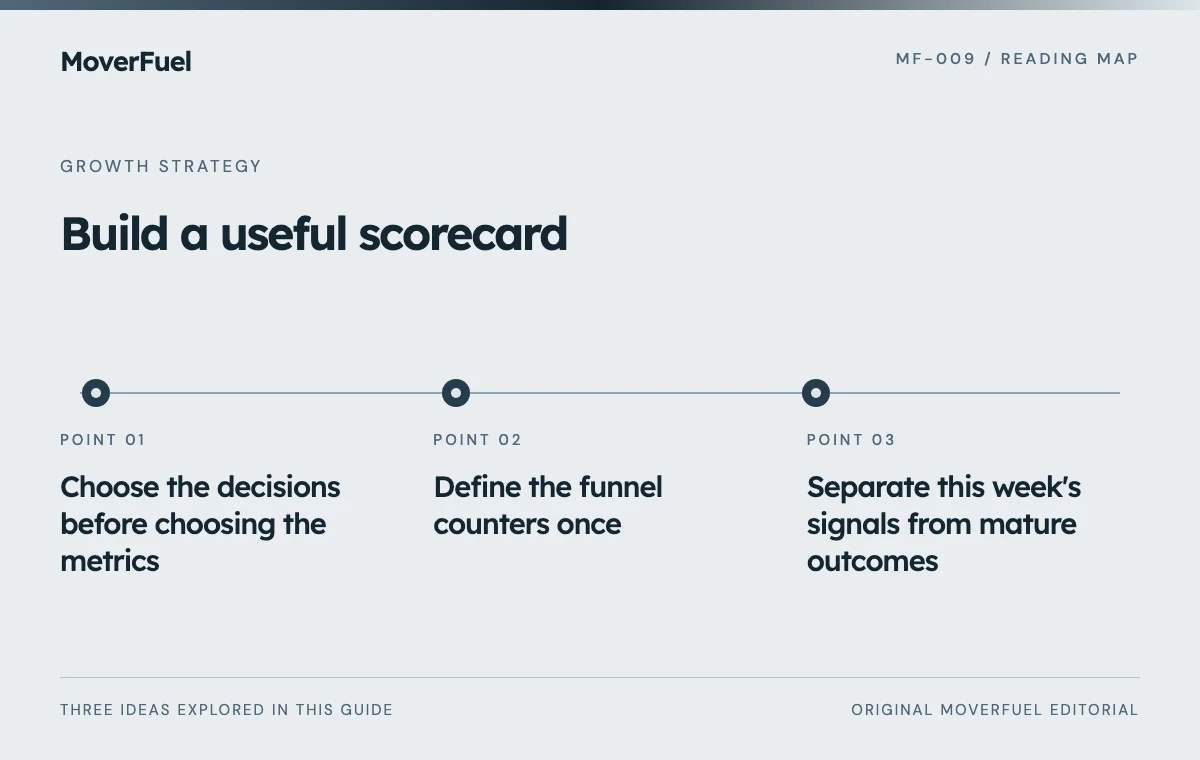
Choose the decisions before choosing the metrics
Ask what the owner, campaign manager, sales lead and dispatcher can change in the coming week. The owner may need to approve a test budget. Sales may need to redistribute unresolved inquiries. Dispatch may need to communicate limited dates. Each decision needs a different view of the same customer journey.
Scroll the table horizontally to compare all columns.
| Decision | Evidence needed | Owner |
|---|---|---|
| Increase acquisition spending | Mature qualified outcomes, economics and remaining capacity | Business owner with marketing and dispatch |
| Repair the inquiry handoff | Unassigned records, missed calls and pending follow-up | Sales or intake lead |
| Change service messaging | Documented reasons for unsuitable inquiries | Marketing lead with an operator |
| Investigate estimate losses | Estimate status, timing and reliable lost reasons | Sales manager |
A metric without an intended decision may still be useful for diagnosis, but it does not need a permanent place on the executive scorecard. Keep deeper reports available behind the summary rather than expanding the summary indefinitely.
Define the funnel counters once
Agree on unique inquiry, contacted prospect, qualified opportunity, estimate, booking and completed move. State which events move a record into each stage and how duplicate contacts are handled. Google supports qualified and converted lead stages, but your company must supply the operating criteria that make those labels meaningful. [1]
Put the denominator beside every rate
‘Conversion rate’ is ambiguous. It might mean form submissions divided by visits, bookings divided by all inquiries or bookings divided by estimates. Name the rate so a reader can tell which handoff it describes. If the definition changes, annotate the change instead of treating the new series as directly comparable.
Scroll the table horizontally to compare all columns.
| Metric | Definition to document | Common ambiguity |
|---|---|---|
| Qualification rate | Qualified unique inquiries / unique inquiries in the cohort | Whether unreachable records are excluded |
| Estimate progression | Opportunities receiving the defined estimate step / qualified opportunities | Scheduled versus completed estimates |
| Booking rate | Accepted bookings / the stated preceding stage | Whether the denominator is leads or estimates |
| Completion rate | Completed jobs / bookings in the cohort | How cancellations and reschedules are handled |
Separate this week's signals from mature outcomes
Use an operational section for recent inquiries, response coverage and unresolved work. Use a separate outcome section for cohorts old enough to produce a meaningful estimate, booking or completion result. This prevents an unfinished sales cycle from appearing as a sudden collapse in marketing efficiency.
For example, a new commercial inquiry may still be arranging a survey while a local residential request has already booked. The scorecard should show the open commercial opportunity without forcing a premature success or failure label. Preserve inquiry date, booking date and service date for the different questions they answer.
Segment only where the comparison changes a decision
Start with the service and market distinctions that affect the operation. Local, interstate and commercial work can have different qualification and timing. Separate an established branch from a newly launched market when their maturity differs. Avoid slicing every report into so many combinations that each cell contains too little evidence to interpret.
Use a drill-down rule: investigate a segment when it is materially different or when the team has a specific question. The scorecard can show the overall pattern and flag the service-market combination requiring review. It does not need to display every campaign, keyword and postal code at once.
The local versus long-distance guide explains why service mix and cohort timing matter when comparing performance.
Show unreliable readings instead of hiding them
Add a data-quality note when records are missing, conversions are duplicated or the period is unusually small. Use ‘not yet available’ when the outcome has not matured. A blank explained honestly is more useful than a forced zero that looks like a completed observation.
- State the source system and update time for each important measure.
- Flag changes to qualification rules, tracking or attribution.
- Record whether cancellations and repeated contacts have been reconciled.
- Identify small or incomplete cohorts before interpreting rate changes.
- Keep estimates and observations visibly separate.
The SBA's guidance calls for consistent measurement when reviewing marketing effectiveness. Consistency here includes stable definitions and the same treatment of missing data across sources. Do not remove inconvenient records from one channel while leaving them in another. [2]
End the scorecard meeting with owned actions
Review the largest meaningful change, ask what evidence could explain it and assign the next check. Avoid turning every movement into an immediate campaign edit. A booking decline could involve service availability, pricing, response coverage or a cohort that has not matured.
Scroll the table horizontally to compare all columns.
| Observation | Next check | Owner and review point |
|---|---|---|
| Qualified inquiries are stable; estimates fell | Inspect unassigned and stalled opportunities | Sales lead before the next weekly review |
| Out-of-area dispositions increased | Validate routes and compare campaign changes | Marketing and intake after a record sample |
| Reported conversions exceed unique inquiries | Trace duplicate events and identifiers | Tracking owner before using the total for budget decisions |
Carry unresolved questions forward until they are answered or deliberately closed. The scorecard becomes useful institutional memory when the next meeting can see the previous observation, action and result. It should make the team more accountable without pretending that every metric change has a simple cause.
Common questions
How many metrics should a marketing scorecard include?
Use the smallest set that supports the team's recurring decisions. Keep diagnostic detail available separately. The right number depends on the services and decisions, not a universal scorecard template.
Should we update every metric weekly?
Operational signals may need frequent review, while booked and completed outcomes need enough time to mature. Show the period and cohort for each measure rather than forcing every metric into the same weekly window.
What should we do when two systems report different lead totals?
Compare definitions, identifiers, dates and duplicate handling before choosing a preferred number. Record the unresolved difference and investigate known records through the systems.
Your next step
Build the scorecard around decisions, define every stage and separate immediate work from mature outcomes. Make uncertainty visible and record the next action. A useful report helps someone change the process for a clear reason.
Sources & editorial notes
Platform claims cite the documents below. Operating frameworks and labeled examples are MoverFuel editorial analysis, not client results or industry benchmarks.
- Google: qualified and converted leadsQualified and converted lead concepts; the scorecard definitions are an operator-owned framework. Reviewed .
- SBA: marketing and salesConsistent marketing and sales measurement and review. Reviewed .