
A funnel dashboard should help a moving company decide where to act. If it shows attractive totals without defining a lead, booking or reporting period, it can conceal the exact problems the team needs to solve. Write the reporting specification before choosing chart styles or connecting another data source.
 View full-size graphic ↗
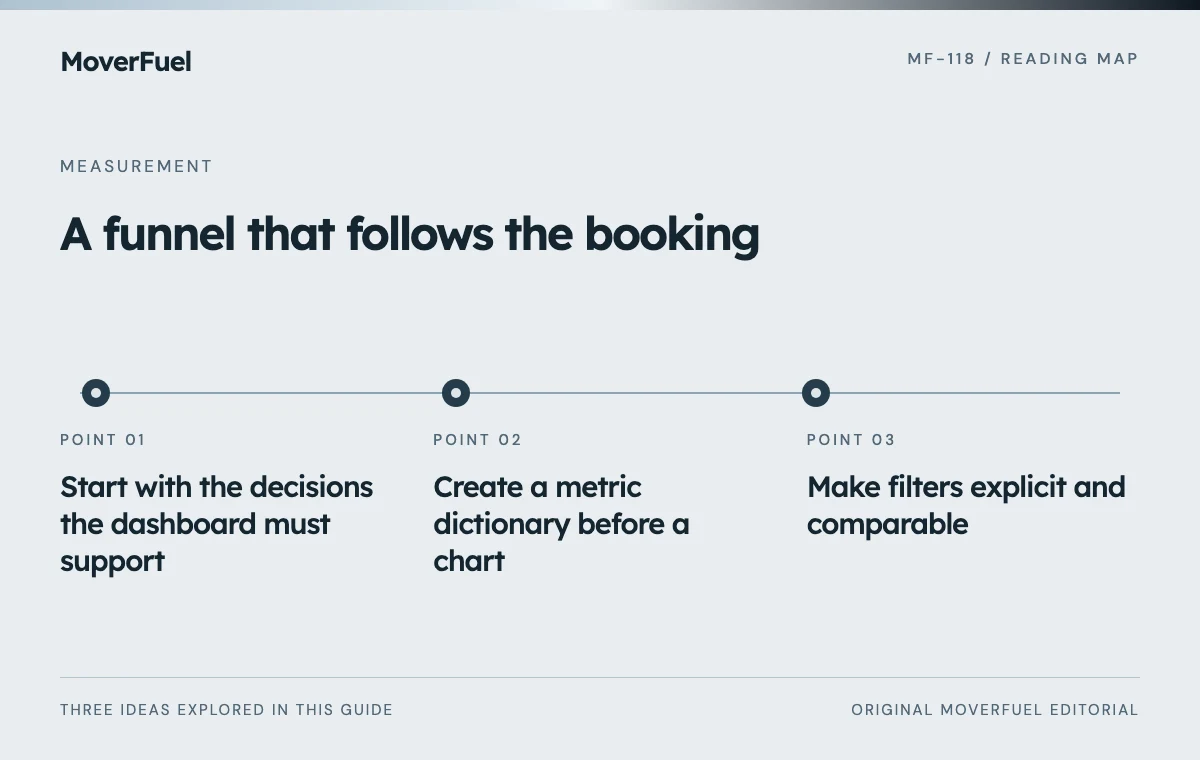
Start with the decisions the dashboard must support
List the recurring decisions: whether to adjust acquisition spend, repair intake, add estimate capacity or investigate a market. Each needs a metric, a comparison and an owner. A chart with no associated decision may belong in a diagnostic appendix rather than the main view.
Scroll the table horizontally to compare all columns.
| Decision | Primary view | Responsible team |
|---|---|---|
| Adjust source investment | Mature qualified and completed outcomes with costs | Marketing and leadership |
| Repair intake | Unassigned and stalled opportunity exceptions | Sales operations |
| Review estimate capacity | Qualified queue and estimate progression | Estimating |
| Investigate cancellations | Booking cohort with later outcomes | Sales and operations |
| Resolve reporting uncertainty | Missing data and integration health | System owner |
Decide which information belongs in the management summary and which requires a drill-down. The summary should reveal a problem quickly; the detail should provide enough evidence to investigate it without exposing unnecessary customer information.
Create a metric dictionary before a chart
For every metric, record its unit, formula, source system, inclusion rules, time basis and refresh expectation. A card labeled ‘leads’ is insufficient if it combines phone calls, forms and unique projects without deduplication.
Scroll the table horizontally to compare all columns.
| Metric | Definition | Required note |
|---|---|---|
| Unique inquiries | Distinct moving opportunities first received in the cohort | Duplicate policy |
| Qualified opportunities | Inquiries meeting documented fit rules | Unknowns shown separately |
| Delivered estimates | Defined estimates received by eligible prospects | Preparation is not delivery |
| Bookings | Unique opportunities meeting booking criteria | Cancellations retained as later outcomes |
| Acquisition cost | Named cost scope divided by a named outcome | Media-only or broader scope |
| Revenue | Defined invoiced or collected amount | Not interchangeable with contribution |
GA4 separates user, session and event scopes. If analytics data is included, preserve that distinction in the specification instead of mixing a user-acquisition dimension with a differently scoped outcome and assuming the result is a business cohort. [1]
Use the outcome ladder as the starting point for stage definitions and ownership.
Make filters explicit and comparable
Provide service type, source, branch and cohort filters only when the underlying data can support them. Show the selected date basis prominently. A user should know whether they are viewing inquiries acquired in October or jobs completed in October.
Show how mature the outcomes are
Include an observation date and open-opportunity count. A recent cohort should not appear to have a final low booking rate when estimates are still active. Compare cohorts at a similar age or make the different maturity visible.
Avoid combining markets with different service mixes into one ranking without context. A commercial branch may have fewer projects and longer cycles than a local residential branch. Let the user inspect the mix before interpreting a percentage difference.
Give exceptions equal standing with performance cards
Scroll the table horizontally to compare all columns.
| Exception | Display | Action owner |
|---|---|---|
| Unassigned inquiry | Count and oldest age | Intake manager |
| Missing source | Count and affected share | Tracking owner |
| Stalled estimate | Reason and next-action age | Estimator |
| Import failure | Last success and unresolved errors | Integration owner |
| Uncertain duplicate | Review queue | CRM administrator |
| Stale financial data | Last refresh and excluded period | Finance |
Keep exception criteria documented and actionable. A red indicator should lead to a defined investigation, not merely create urgency. Avoid alerts that repeatedly fire without an owner or a repair path.
Protect customer data in exports and drill-downs. Most management decisions can begin with aggregate counts and internal references. Access to contact details, call recordings or sensitive move information should follow the business's approved permissions.
Test the dashboard against known records
Prepare a controlled dataset containing a new inquiry, repeat call, form retry, qualified opportunity, delivered estimate, booking, cancellation and missing source. Calculate expected totals manually, then confirm the dashboard reproduces them under each relevant filter.
Check empty periods, zero denominators, delayed imports and time-zone boundaries. Confirm that a source filter does not silently exclude records from a denominator that the displayed rate still claims to use. Test exports as well as the screen view.
This article describes a reporting specification, not a claim that a live proprietary dashboard or CRM connection exists. Implement it with the systems actually available, document remaining gaps and release only the metrics that can be supported.
After launch, maintain a change log for definitions and mappings. When a rule changes, annotate the affected period so the team does not mistake a reporting revision for sudden commercial improvement.
Common questions
Should every available metric be on the dashboard?
No. Prioritize recurring decisions and keep diagnostic detail accessible. Too many undefined totals can make the important exceptions harder to see.
Can the dashboard use sample data before integrations exist?
Yes, if it is clearly labeled as illustrative and is not presented as real business performance. Production metrics need verified data paths.
Your next step
A useful dashboard is a tested agreement about definitions, dates and decisions. Include data-quality exceptions so the team can see both performance and the limits of its evidence.
Sources & editorial notes
Platform claims cite the documents below. Operating frameworks and labeled examples are MoverFuel editorial analysis, not client results or industry benchmarks.
- Google Analytics: scopes of traffic-source dimensionsAnalytics user/session/event scope distinctions. Dashboard design, exception panel and acceptance tests are original vendor-neutral specifications. Reviewed .