
A customer browsing in one city can arrange a move from another city to a third. The nearest branch may not be the branch that performs the work. A service-area report must preserve those distinctions or it can credit the wrong market, hide expensive routes and encourage budget changes based on an inaccurate map of demand.
 View full-size graphic ↗
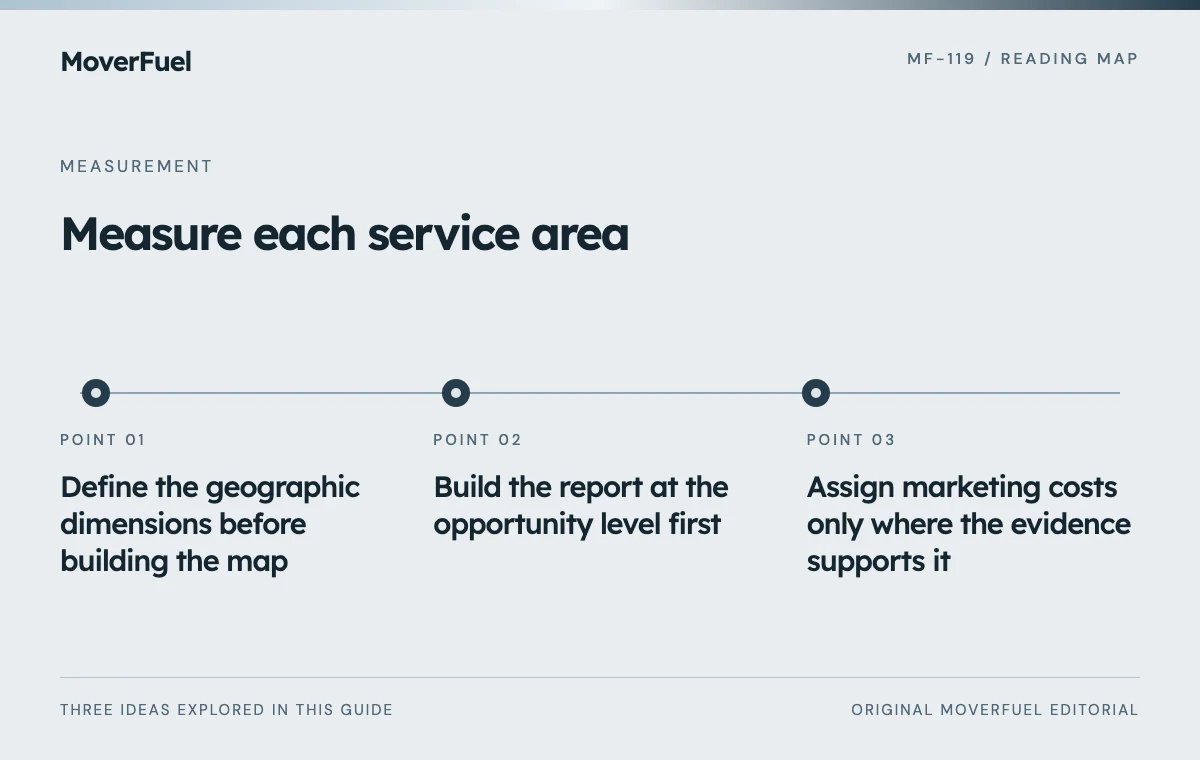
Define the geographic dimensions before building the map
Scroll the table horizontally to compare all columns.
| Dimension | Source of evidence | Business use |
|---|---|---|
| Observed visitor location | Analytics or platform signal | Traffic diagnosis with accuracy limits |
| Move origin | Customer-confirmed inquiry information | Collection-area demand |
| Move destination | Customer-confirmed inquiry information | Route and delivery demand |
| Operating branch | Actual assignment | Capacity and fulfillment accountability |
| Campaign target | Advertising configuration | Compare intended and received demand |
| Reporting area | Documented aggregation rule | Consistent market comparisons |
Choose a stable area definition such as an agreed group of postal codes or municipalities. Record how boundary cases are handled. A market label that changes with each report can create apparent growth without any real change in demand.
Keep exact customer addresses in the appropriate operational system. Google's Analytics guidance warns against sending personally identifiable information through ordinary collection, including URLs and user-entered data. Use approved aggregate area categories for marketing reports rather than transmitting raw move details indiscriminately. [1]
Build the report at the opportunity level first
Start with unique opportunities and their acquisition dates, then attach geography, service type, source and later outcomes. Retain unknown origin or destination values as explicit states. Do not infer the route from an IP-based location when customer information is missing.
Scroll the table horizontally to compare all columns.
| Opportunity | Origin | Destination | Assigned branch | Interpretation |
|---|---|---|---|---|
| Example A | North market | North market | North | Local demand and local fulfillment |
| Example B | North market | South market | North | Route demand crossing market boundaries |
| Example C | East market | Unknown | Central intake | Needs clarification before area classification |
| Example D | South market | South market | North | Local demand with cross-branch fulfillment |
These are fictional records used to explain the model. The table shows why one ‘city’ column is insufficient. Marketing may need an origin view while operations needs an assigned-branch view; both can be correct when clearly labeled.
Keep demand and fulfillment views separate
An origin-area report answers where work is requested. A branch report answers which team handles it. Do not interpret a branch's completed jobs as proof that all those customers originated in the branch's local market.
Assign marketing costs only where the evidence supports it
A campaign dedicated to one area may have a direct cost allocation. A regional campaign serving several areas needs an explicit allocation method or a separate shared-cost line. Avoid inventing exact market spend by dividing the budget equally when delivery and demand are uneven.
Separate measured costs from allocated costs in the report. If a cost is apportioned using clicks, inquiries or another driver, state the rule and its limitation. The allocation choice can affect area-level acquisition cost without changing total company spend.
Scroll the table horizontally to compare all columns.
| Cost type | Possible treatment | Required disclosure |
|---|---|---|
| Dedicated market campaign | Assign directly | Campaign-to-area mapping |
| Shared regional media | Documented allocation or shared line | Allocation driver and uncertainty |
| Site-wide content investment | Separate common investment | Why it is not assigned precisely |
| Branch-specific creative | Assign to intended branch or market | Demand versus fulfillment basis |
Reconcile area totals back to the overall cost ledger. Shared costs should not disappear or be counted in full under every market. Keep a visible remainder when the evidence does not support complete allocation.
Compare like-for-like work at similar maturity
Segment by service before comparing area economics. Long-distance routes, local apartments and commercial projects can have different sales cycles, revenue and fulfillment costs. A blended market average may mostly describe its service mix.
Use inquiry cohorts at a comparable age and show still-open opportunities. Include counts next to rates and avoid ranking a tiny market sample as though it were stable. When evidence is sparse, use a range or an observation note rather than a confident league table.
Use the out-of-area lead framework to distinguish a reporting boundary issue from genuinely unserviceable demand.
Use the report to make a specific market decision
A useful review might identify a market with qualified demand but insufficient estimate coverage, a route with high cancellations or a branch receiving work it cannot fulfill efficiently. Each finding suggests a different action; not every geographic difference calls for a bidding adjustment.
Record the proposed action, expected mechanism and measurement plan. If coverage expands, update the serviceability rules and reporting map together. Preserve historical definitions so an expanded boundary does not make past periods appear directly comparable when they are not.
Review unknown geography and assignment exceptions regularly. Better area reporting comes from accurate intake and stable definitions, not from a more colorful heat map.
Common questions
Can visitor location stand in for move origin?
No. A person can research from somewhere other than the collection address. Use customer-confirmed move information for route analysis.
How should shared campaign costs be assigned to areas?
Use a documented, defensible allocation or report them separately. Disclose the method and reconcile the total instead of presenting invented precision.
Your next step
Separate where customers browse, where moves originate and which branch fulfills them. Geographic performance becomes useful when cohorts, costs and service mix are comparable.
Sources & editorial notes
Platform claims cite the documents below. Operating frameworks and labeled examples are MoverFuel editorial analysis, not client results or industry benchmarks.
- Google Analytics: avoid personally identifiable informationAnalytics restrictions on recognizable personal data, including user-entered and URL data. Geographic cohort and allocation model is original. Reviewed .