
The market with the most leads is not necessarily the best place for the next marketing dollar. It may have more spending, a different service mix or a faster booking cycle. Compare markets only after aligning the units, definitions and time periods. Then account for what each operation can deliver and which differences the team can actually influence.
 View full-size graphic ↗
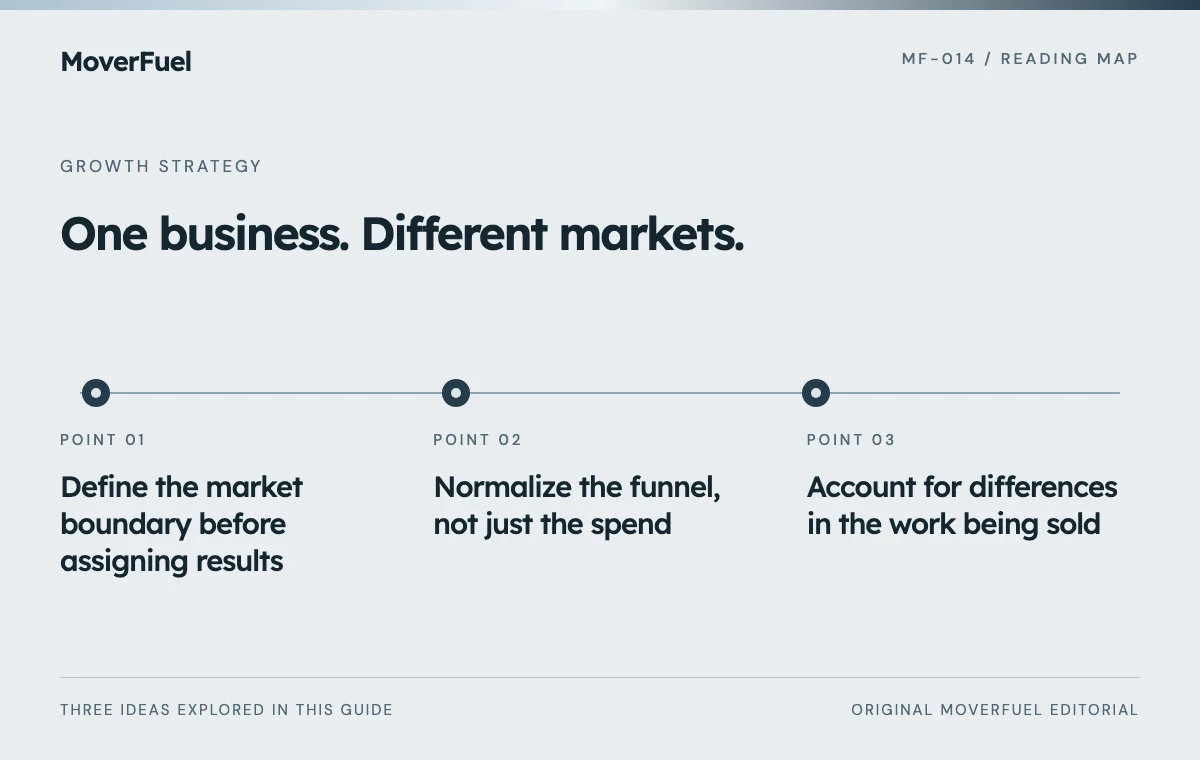
Define the market boundary before assigning results
Decide whether a market means a branch, an origin area, a service territory or a campaign grouping. These boundaries can overlap. A customer may contact one office for a move handled by another, and an interstate job can involve two regions. Document how those records are assigned.
Do not use the searcher's location as the sole definition of the service market. Google's geographic targeting relies on presence and interest signals with limitations. The origin, destination and fulfilling operation may provide more useful business context than the device location alone. [1]
Scroll the table horizontally to compare all columns.
| View | What it describes | Potential overlap |
|---|---|---|
| Origin market | Where the move begins | A different office may handle the sale or fulfillment |
| Branch | The operating unit responsible | The branch may serve several areas |
| Campaign geography | The audience settings used for advertising | Settings do not perfectly identify every job route |
| Destination market | Where the move ends | It may not represent a local acquisition opportunity |
Normalize the funnel, not just the spend
Use the same inquiry and qualification definitions across markets, with explicit service-specific exceptions. If one branch calls every form qualified while another waits for a conversation, the reported rates do not measure the same thing. Resolve that difference before ranking performance.
Use a consistent cost scope
Compare media-only costs with media-only costs, or broader acquisition costs with the same included categories. Identify whether local production, software and sales effort are included. A market can appear inexpensive because part of its cost is recorded elsewhere.
Scroll the table horizontally to compare all columns.
| Measure | Market A | Market B |
|---|---|---|
| Media spend | $6,000 | $3,000 |
| Unique inquiries | 100 | 60 |
| Qualified inquiries | 50 | 36 |
| Booked moves | 20 | 12 |
| Media cost per booked move | $300 | $250 |
These invented values show why volume alone is insufficient. Market A produces more bookings, while Market B has a lower media cost per booking. Neither result settles the allocation decision without contribution, capacity, cancellations and evidence about what additional spending would produce.
Account for differences in the work being sold
Separate meaningful service categories before interpreting a blended average. Commercial projects, local household jobs and interstate routes can require different sales work and fulfillment resources. A market with more of one service may have a different average ticket or lead-to-booking timeline for reasons unrelated to campaign quality.
Keep the comparison understandable. Start with the services that materially affect the decision rather than creating dozens of tiny segments. Where the data is sparse, show the counts and limitations alongside the rates. A large percentage movement based on a few outcomes deserves investigation, not an automatic budget shift.
Review the local and long-distance acquisition differences before combining their outcomes into a market score.
Use actual cost and completion records when evaluating job value. Revenue can identify scale, but it does not explain the value left after the work is delivered. Avoid assigning a uniform contribution assumption to unlike services merely to complete a comparison table.
Separate launch conditions from steady operation
A new market may still be building its service information, intake routines and reliable source data. An established branch may benefit from existing customer familiarity and referrals. Compare the actual operating stage rather than expecting both to produce identical results immediately.
Maintain a dated change log for launches, staffing changes, new services and tracking repairs. Use mature cohorts for outcomes and current-period signals for operational checks. The SBA's emphasis on consistent measurement and updating the plan supports this separation between observations and decisions. [2]
Transfer a verified improvement, not an unexplained setting
When one market performs better, identify the mechanism worth testing elsewhere. It might have clearer service messaging, more reliable call coverage or a simpler estimate handoff. Copying its budget or keyword list without understanding the service context can reproduce the wrong part of the system.
- Name the observed difference and verify the underlying records.
- Identify the process or offer that could plausibly explain it.
- Check whether the other market has the same relevant conditions.
- Define a bounded test and an owner.
- Review the outcome without assuming the original result will repeat.
Some differences will not be transferable. Route availability, customer mix and operating capacity can make a tactic useful in one market and unsuitable in another. Record that boundary so the organization learns where the approach belongs.
Allocate the next increment using capacity and evidence
Ask what additional investment can accomplish in each market. Historic average performance does not guarantee the same result at a higher spend. A strong branch may already be near capacity, while another has room but needs an estimate-process repair before it can use more demand.
Scroll the table horizontally to compare all columns.
| Condition | Decision to evaluate |
|---|---|
| Good mature outcomes, spare capacity | A bounded increase with a new review point |
| Suitable demand, weak estimate progression | An intake or conversion improvement before more reach |
| Low-quality demand | Service, route and offer diagnosis |
| Unreliable data | Measurement repair before a confident market ranking |
| Capacity constrained | Service-mix, pricing or operational decisions |
Keep the resulting decision tied to the evidence and assumptions. A fair market review should explain why money or effort moves, what would change that decision and who will verify the next outcome. It should not reduce complex operations to a leaderboard of raw leads.
Common questions
Should every branch receive the same advertising budget?
Not automatically. Compare objectives, capacity, costs and mature outcomes. Equal budgets can be a controlled test choice, but they are not a universal allocation rule.
Can cost per lead rank market performance?
It describes one stage. Qualification, booking, completion, service mix and contribution can change the conclusion. Use the same definitions and disclose incomplete data.
What should we do with a market that has very little data?
Show the limited counts, use cautious ranges and define what the next test should learn. Do not manufacture a precise ranking from an immature cohort.
Your next step
Align the boundaries, definitions and time periods before comparing markets. Explain service mix and maturity, then allocate the next increment around capacity and a testable opportunity. The useful result is a reasoned decision, not a league table.
Sources & editorial notes
Platform claims cite the documents below. Operating frameworks and labeled examples are MoverFuel editorial analysis, not client results or industry benchmarks.
- Google: advanced location optionsGeographic presence/interest distinctions and signal limitations. Reviewed .
- SBA: marketing and salesConsistent marketing measurement and plan review; the comparison method and numbers are original illustrative analysis. Reviewed .