
A high GA4 bounce rate is a reason to investigate, not a diagnosis of a bad moving-company website. First understand what GA4 counts as an engaged session. Then check tracking, traffic intent and the visitor's actual task. The useful outcome is a clearer path to a suitable inquiry, not a lower percentage created by changing the measurement.
 View full-size graphic ↗
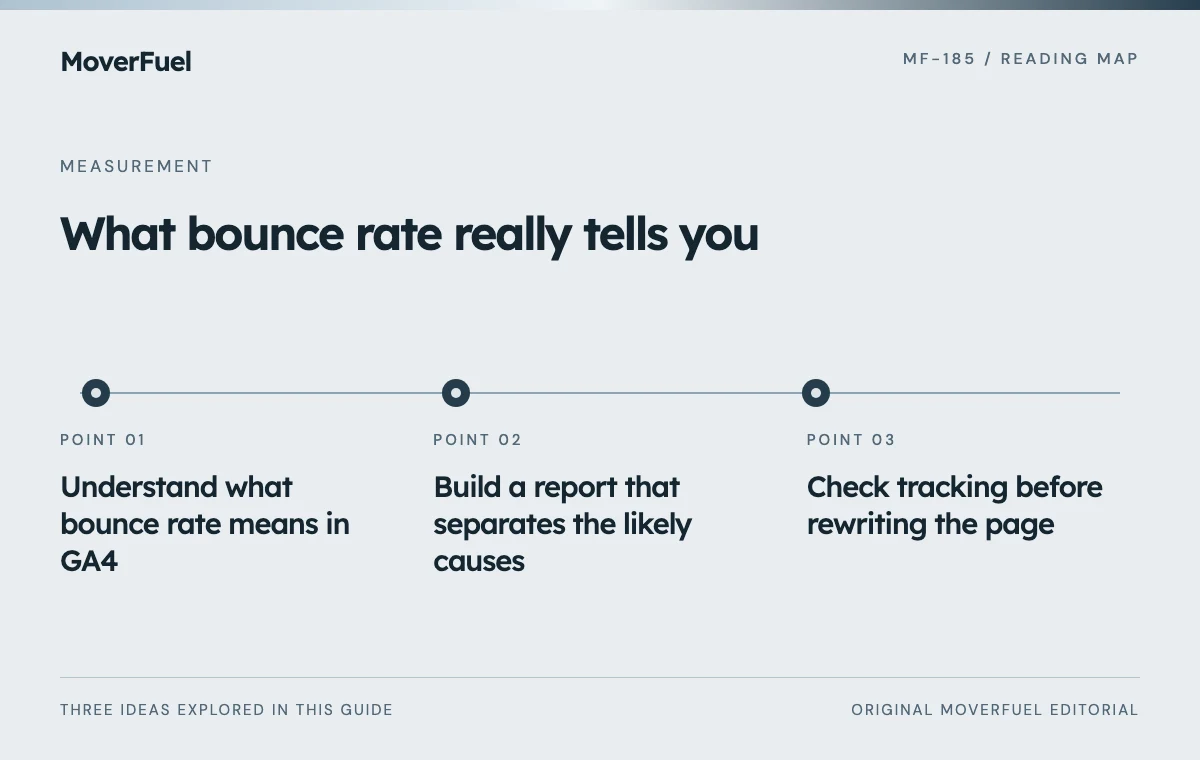
Understand what bounce rate means in GA4
GA4's bounce rate is the percentage of sessions that are not engaged. Under its default definition, a session is engaged if it lasts longer than ten seconds, includes a key event or has at least two page or screen views. Only one of those conditions is needed. Bounce rate is the inverse of engagement rate. [1]
Scroll the table horizontally to compare all columns.
| Example session | Engaged under the default rules? | Why |
|---|---|---|
| One page, 6 seconds, no key event | No | None of the engagement conditions is met |
| One page, 25 seconds, no key event | Yes | Duration exceeds the default threshold |
| Two page views in 7 seconds | Yes | The page-view condition is met |
| One page, 7 seconds, a valid key event | Yes | The key-event condition is met |
In a simplified example with 100 sessions and 65 engaged sessions, engagement rate is 65% and bounce rate is 35%. Those numbers illustrate the calculation; they are not moving-industry benchmarks. A long single-page visit can be engaged even when the person never requests a quote.
Google documents the timer under the web data stream's tag settings and Adjust session timeout controls. Use the setting that fits your measurement plan, and annotate changes so an apparent improvement is not mistaken for a change in visitor behavior. [2]
Build a report that separates the likely causes
Open a suitable detail report and, with the required editing permissions, add Engagement rate and Bounce rate if they are missing. Google's instructions explain how to customize report metrics. Compare like-for-like periods and inspect sessions alongside the percentages; a rate without its volume can be misleading. [1]
Scroll the table horizontally to compare all columns.
| Breakdown | What to inspect | Question it can answer |
|---|---|---|
| Landing page | Entry page and its intended next step | Is the issue isolated to a particular experience? |
| Session source / medium | Traffic origin using a consistent acquisition scope | Did the audience mix change? |
| Device category | Phone versus desktop experience | Is mobile interaction or layout causing friction? |
| Service or page purpose | Local, long-distance, packing or informational content | Are unlike visitor tasks being averaged together? |
| Date and release history | Tracking, consent, campaign and site changes | Did a measurement or traffic change coincide with the shift? |
Start with a small set of meaningful segments rather than an enormous cross-tabulation. A handful of sessions in a narrow city-and-device segment cannot support a confident conclusion. Note data gaps and allow for the time customers need to request an estimate or call later.
Check tracking before rewriting the page
Inspect what happens on a successful inquiry path. An event should represent the action its name implies. A button click is different from a successfully accepted form, and a tap on a phone link is different from a connected, qualified call. If those are mixed together, the engagement metric can look healthy while sales evidence remains weak.
Google recommends generate_lead for lead generation and describes DebugView and Realtime as tools for verifying incoming events. Test that the event fires at the intended success point and is not duplicated. When testing a live form, use an approved test workflow that cannot send unwanted records into the production sales process. [3]
- Check for duplicate page views from overlapping tags or navigation handling.
- Verify that key events represent meaningful actions instead of arbitrary page activity.
- Confirm what your consent configuration allows GA4 to observe.
- Inspect a mobile visit through the quote path, including any third-party form or booking handoff.
- Compare the date of the metric change with tag, consent and site releases.
Do not add artificial keep-alive events simply to make visitors look engaged. Google's developer guidance warns that such events can create zombie sessions and inflate engagement. A metric improvement created by synthetic activity does not improve the customer's experience. [4]
Our GA4 lead-tracking guide covers the wider setup. Use the call-tracking guide to connect phone interactions with actual call outcomes.
Match the investigation to the visitor's task
A person reading a packing answer may leave after getting what they needed. Another may leave because an ad promised a service the landing page does not offer. The same percentage can hide those very different experiences. Read the ad, search context where available and landing page together before changing copy.
Scroll the table horizontally to compare all columns.
| Observed pattern | Inspect next | Possible repair to test |
|---|---|---|
| A paid campaign sends unsuitable inquiries | Ad message, targeting, search terms where available and page offer | Align the promise and service qualification |
| Mobile visitors struggle to request a quote | Form controls, errors, page loading and tap targets | Repair the verified interaction problem |
| A useful article attracts readers but few immediate quotes | Article intent and relevant onward links | Offer a natural next resource without forcing a sales action |
| Bounce rate changes suddenly across all pages | Tags, key events, timer, consent and traffic mix | Resolve measurement changes before redesigning |
| Engagement improves but lead quality worsens | What the key events count and who the traffic reaches | Reconcile events with qualified inquiries |
Use real page inspection to substantiate the hypothesis. If the form fails on a phone, reproduce and repair that failure. If an article already answers the question clearly, adding length or unnecessary clicks merely to raise engagement can make it less useful.
Judge repairs by inquiry quality as well as engagement
Write down the problem, the change, its date and the outcome you expect. Keep tracking definitions stable during the comparison where possible. Review the same landing pages and traffic segments, and account for material differences in campaign mix, seasonality and volume.
Pair engagement with accepted inquiries, qualified calls, estimates and bookings using your established definitions. A lower bounce rate does not by itself demonstrate better search visibility, more suitable leads or increased profit. It is one diagnostic signal inside a wider acquisition review.
If the metric is your only evidence, leave the conclusion narrow. You can say measured engagement changed under the recorded settings. You cannot automatically say the redesign caused more bookings or that the page will rank better. Continue collecting the business outcomes needed for the decision.
The report reconciliation guide helps connect analytics with intake and CRM records. For choosing software that preserves those outcomes, see the moving CRM comparison.
Common questions
What is a good bounce rate for a moving company website?
There is no single defensible target for every page, source and tracking setup. Compare similar visitor tasks under stable settings, then check whether the experience produces suitable inquiries and booked work.
Does a single-page visit always count as a bounce in GA4?
No. A single-page session can qualify as engaged through its duration or a valid key event. Check the configured engaged-session timer rather than importing an older analytics definition.
Why is my bounce rate suddenly almost zero?
Investigate duplicated page views, overly broad key events, timing changes and a changed traffic mix before celebrating. Reproduce the event sequence and compare it with real lead outcomes.
Should I change the engagement timer to improve the report?
Choose the timer for a consistent measurement purpose, not to manufacture a favorable percentage. Record any change and avoid comparing periods with different definitions as if visitor behavior alone caused the difference.
Your next step
Define engagement correctly, check the measurement and isolate the affected visitor task. Repair demonstrated friction, then assess suitable inquiries and bookings alongside the GA4 metric.
Sources & editorial notes
Platform claims cite the documents below. Operating frameworks and labeled examples are MoverFuel editorial analysis, not client results or industry benchmarks.
- Google Analytics: Engagement rate and bounce rateEngaged-session definition, inverse bounce rate and adding engagement metrics to reports. Reviewed .
- Google Analytics: About Analytics sessionsEngaged-session timer is configurable; session timeout is a separate setting. Reviewed .
- Google Analytics: Recommended eventsgenerate_lead is a recommended event; DebugView and Realtime support event verification. Reviewed .
- Google Analytics developer guide: SessionsAvoid artificial keep-alive events that create zombie sessions and inflate engagement. Reviewed .